
T
Thierry Ciot
Guest
With Rollbase and Kendo UI, it's easy to create beautiful low-code apps. Learn how to easily create custom gauges with minimal programming.
In a previous blog post, we saw how to create powerful Rollbase dashboards with Kendo UI charts (and without much code).
Today, we will explore how to create radial gauges that can be exploited in dashboards.
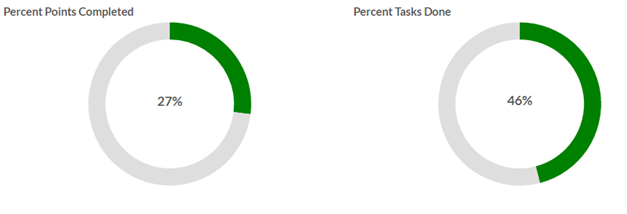
For example, in a Scrum/Sprint application, we may want to have a team dashboard that look like this on tablets and desktops:
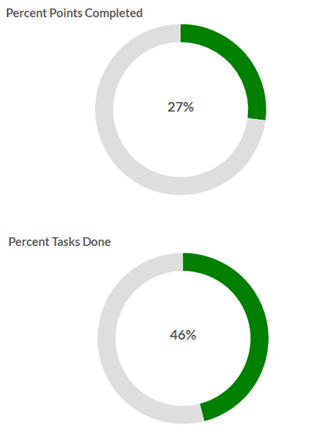
And like this on smartphones:
Note: We will use the term annulus to describe the gauge shape in this post.
Creating the Dashboard
We will work in the page designer. The outline of the work is:
Finally, bind the div element in each column to a Kendo UI Radial Gauge.
Script Details
Here is the code to initialize the Kendo UI Radial Gauge to render as an annulus:
$("#gaugePercentPointsCompleted").kendoRadialGauge({
pointer: [],
scale: {
rangeSize: 20,//To configure the width of range
startAngle: 90,
endAngle: 450,
max: 100,//Max value of scale , in our case will be 100
labels: { visible: false },
majorTicks: { visible: false },
minorTicks: { visible: false },
ranges:
[{
from: 0,
to: {!Percent_Done__Dev_},
color: "#008000"
}]
},
});
The Kendo UI Gauge can be configured to render multiple values as in the following example:
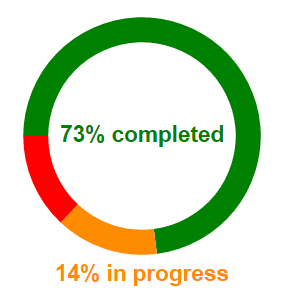
The only difference, code-wise, is that we specify multiple ranges like this:
ranges: [{
from: 0,
to: 73,
color: "green"
},
{
from: 73,
to: 87,
color: "darkorange"
},
{
from: 87,
to: 100,
color: "red"
}]
Customize Your Gauges Easily
Rollbase has a lot of built-in capabilities to create dashboards with its point and click built-in charts and gauges—but sometimes we want more controls by programming the charts and gauges directly. Rollbase offers both options and as you could see here, using Kendo UI linear gauges is very simple and straightforward.
Curious to learn more? You can find out more about Rollbase here, or jump right into a free trial below.
Try Now
Continue reading...
In a previous blog post, we saw how to create powerful Rollbase dashboards with Kendo UI charts (and without much code).
Today, we will explore how to create radial gauges that can be exploited in dashboards.
For example, in a Scrum/Sprint application, we may want to have a team dashboard that look like this on tablets and desktops:
And like this on smartphones:
Note: We will use the term annulus to describe the gauge shape in this post.
Creating the Dashboard
We will work in the page designer. The outline of the work is:
- Create a section with two columns; this gives us, without any programming, the desired responsive behavior. That means on small screens like smartphones, Rollbase will automatically render one gauge per row, and on larger screens Rollbase will render the two gauges side by side. For more information, check out our post explaining how Rollbase automatically creates responsive apps.
- Create two div elements, one for each gauge, by dragging HTML components from the page designer palette. We will bind the Kendo Gauge to these elements.
- Create a script (drag an HTML Script element) in which we will initialize the radial gauge with:
- The actual value to render in the gauge: we use a string token to access the field value from the Rollbase object. There is no need to make any Ajax call to access the value.
- Various configuration options to make the gauges look exactly how we want them (we will look at these options below in more details).
Finally, bind the div element in each column to a Kendo UI Radial Gauge.
Script Details
Here is the code to initialize the Kendo UI Radial Gauge to render as an annulus:
01.
02.
03.
04.
05.
06.
07.
08.
09.
10.
11.
12.
13.
14.
15.
16.
17.
18.
- Line 4: The Annulus ring width is controlled by the option rangeSize in px
- Line 14: We access the Percent Done field from the Rollbase object using the field integration name.
The Kendo UI Gauge can be configured to render multiple values as in the following example:
The only difference, code-wise, is that we specify multiple ranges like this:
ranges: [{
from: 0,
to: 73,
color: "green"
},
{
from: 73,
to: 87,
color: "darkorange"
},
{
from: 87,
to: 100,
color: "red"
}]
Customize Your Gauges Easily
Rollbase has a lot of built-in capabilities to create dashboards with its point and click built-in charts and gauges—but sometimes we want more controls by programming the charts and gauges directly. Rollbase offers both options and as you could see here, using Kendo UI linear gauges is very simple and straightforward.
Curious to learn more? You can find out more about Rollbase here, or jump right into a free trial below.
Try Now
Continue reading...