Long running transaction by a user and his activity code

Mike

Moderator
Hi all,

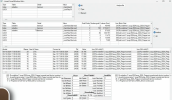
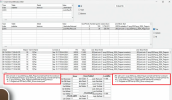
I have a question about long running transactions of database by using R&D and active transaction. We always having transaction number like below:-

45 Rxcm -4 SELF/ABL 06/03/25 08:27 06/03/25 13:20 1746518328 Active

But it is not giving complete info like what table or source code is causing this long running or lock table. Which code is user using complete info of code or program user using. If there any chance to know what table or source code is causing this long running or lock table?


Thanks regards
 
Please provide your OpenEdge version number. It matters when dealing with issues of how OpenEdge behaves, and in particular when parsing output of Progress utilities.

When providing data from promon, please also provide the column headers so we don't have to guess what the data means.
 
Hi Rob,

Thanks for your response.
version is = 11.2

Promon result

Status: Active Transactions by user number for all tenants

Usr:Ten Name Domain Type Login time Tx start time Trans id Trans State
45 Rxcm -4 SELF/ABL 06/03/25 08:27 06/03/25 13:20 1746518328 Active


Thanks regards
Mike
 
Which code is user using complete info of code or program user using.

You can use:
_Connect._Connect-Cache* to get the program name run by the user.
_UserLock._UserLock-Table - inte[512] -> Table #
_UserTableStat with the increments of _UserTableStat-update or _UserTableStat-create -> _UserTableStat-Num = Table #

Since 11.7:
_Trans: no increments of _Trans-BIRecReads or _Trans-BIRecWrites -> user does noting.
_UserIO: _UserIO-BIRecReads and _UserIO-BIRecWrites
 
BTW, you can't get the program names while a transaction is in an undo phase.
Neither with _Connect-Cache* nor with kill -SIGUSR1.
I guess the same is true for a subtransaction undo but I did not check it.
 
BTW, you can't get the program names while a transaction is in an undo phase.
Neither with _Connect-Cache* nor with kill -SIGUSR1.
I guess the same is true for a subtransaction undo but I did not check it.

Hi George,

Thanks for replying. As you said we can use _Connect._Connect-Cache* which data field in _connect table? to get the program name run by the user which . Can you please help me to get exact query and execute in progress editor to find out the user connected and their activities? Need to executed the below in progress editor?: -

FOR EACH _Connect:
DISPLAY _Connect-Usr _Connect-Name _Connect-Type _Connect-CacheInfo .
END.


22 _Connect-IPAddress char m x
xx 23 _Connect-CachingType inte m x
xx 24 _Connect-CacheLastUpdate char m x
xx 25 _Connect-CacheInfoType char m x
xx 26 _Connect-CacheLineNumber inte[32] m x
xx 27 _Connect-CacheInfo char[32] m x
xx 28 _Connect-TenantId inte m x
xx 29 _Connect-DomainId int6 m x
xx x

OR

we use Client Database-Request Statement Caching?After enable Client Database-Request Statement Caching what will be the output and how we grep the code that user executing?


Thanks Mike
 
how we grep the code that user executing?
I don't have a ready-to-run code example but the idea is simple:
Code:
/* ipConnectUsr is a user number */
 
FOR FIRST DICTDB._Connect NO-LOCK
    WHERE DICTDB._Connect._Connect-Id  EQ ipConnectUsr + 1
TRANSACTION:
  FIND CURRENT DICTDB._Connect EXCLUSIVE-LOCK.
  ASSIGN DICTDB._Connect._Connect-CachingType = 3. /* One time capture */
END. /* _Connect */

/* Two Hours Later */

FOR FIRST DICTDB._Connect NO-LOCK
    WHERE DICTDB._Connect._Connect-Id EQ ipConnectUsr + 1:

    ASSIGN vCacheList = "":U
           vCacheTime = DICTDB._Connect._Connect-CacheLastUpdate
    . /* ASSIGN */
    DO i = 1 TO EXTENT(DICTDB._Connect._Connect-CacheInfo)
      WHILE DICTDB._Connect._Connect-CacheLineNumber[i] NE ?
        AND DICTDB._Connect._Connect-CacheInfo[i]       NE ?:
      ASSIGN vCacheList = vCacheList + ",":U
                   + DICTDB._Connect._Connect-CacheInfo[i] + ":":U
                   + STRING(DICTDB._Connect._Connect-CacheLineNumber[i])
      . /* ASSIGN */
    END. /* DO i = 1 */

    DO TRANSACTION:
      FIND CURRENT DICTDB._Connect EXCLUSIVE-LOCK.
      ASSIGN DICTDB._Connect._Connect-CachingType = 0. /*Turns off caching*/
    END. /* TRANSACTION */

/* Turns on caching again if you need to:
    DO TRANSACTION:
      FIND CURRENT DICTDB._Connect EXCLUSIVE-LOCK.
      ASSIGN DICTDB._Connect._Connect-CachingType = 3.
    END. /* TRANSACTION */
*/
END. /* _Connect */

CachingType = 3 will enable the "hunting" for the statement caching.
The first database request of ipConnectUsr will update CacheLastUpdate, CacheInfo and CacheLineNumber.
The next requests will not change these fields. They will store the information exactly the first request after assigning CachingType = 3.
The request may happen just a millisecond after the "hunting" begins. Or a second later. Or two hours later. ;-) It depends how active is the user. In other words we should wait a bit before we will re-read _Connect record.

Important: you need to set CachingType = 0 before you can use CachingType = 3 again.

I beg you not to listen to those who like to use CachingType = 1. :)
This option may cause performance degradation.
 
George said:
I beg you not to listen to those who like to use CachingType = 1. :)
This option may cause performance degradation.

That depends entirely on your circumstances.

Sure, if you have hundreds (or thousands) of remote connections enabling "cachingType = 1" for all of them could be rather painful. ("2" would be even worse...)

But if they are all shared memory connections the penalty is pretty small. (And we can see that this user is a shared memory user...)

And, of course, a lot depends on what problem you are trying to solve.

In this particular case I think that it would be just as effective, and much simpler, to get a stack trace with proGetStack.
 
But if they are all shared memory connections the penalty is pretty small.
How often the client statement cache is updated? Once per db request? How many db requests per second does an active client generate? The hundred times? The thousands? Each update of the statement cache creates an extra USR latch lock. Each cache update /may/ create an extra disk io - if a call stack is a bit long (the most cases) and does not fit in a short memory allocated by Progress (a fixed limit).

Will we read the procedure stack a thousand times per second? Of course, no. Once per a few seconds is a minimum. Using CachingType = 1 we force a client to collect several thousand times more information than we are going to read. CachingType = 3 collects information only once - exactly /after/ our request. With CachingType = 1 we get the information left by the /last/ client’s action /before/ we read the _Connect record. In both cases, we should pay attention to the _Connect-CacheLastUpdate labeled "Stmt Cache Last Update Time".

If we will enable the statement cache only for one client then most likely we will not notice the performance degradation. If it would be done for the thousand users then the performance problems are guaranteed. Even for self-service connections - we will get at least the competition for the USR latch (semaphore latch waits).

At least in the earlier Progress versions there was an post effect of enabling statement cache - the USR latch activity did not return to its initial level when we disabled statement cache. The world will never be the same again - until db restart.

In this particular case I think that it would be just as effective, and much simpler, to get a stack trace with proGetStack.
Agree. Often the root cause of the long transactions is the inactive users. Program prompts the input from an end user inside the transaction. The user may leave his/her session for a long time. I can be wrong but the statement cache will not be updated when a session is waiting for an input from keyboard (unlike, for example, with waiting for a record lock). But proGetStack or kill -USR1 will cause a session to generate a protrace file. On the other hand, the ABL approach can gather the _UserLock, _UserTableStat, _Trans-BIRecReads and _Trans-BIRecWrites and their changes over time. Every site must run a tool to monitor the long transactions. Using VST tables is a universal solution. proGetStack is not.
 
BTW, if a process rolls back the long transaction then the changes of _UserLock, _UserTableStat and _Trans are the only useful information we can get. proGetStack will not report a call stack.
 
... CachingType = 3 collects information only once - exactly /after/ our request. With CachingType = 1 we get the information left by the /last/ client’s action /before/ we read the _Connect record. In both cases, we should pay attention to the _Connect-CacheLastUpdate labeled "Stmt Cache Last Update Time".

Sure.

And depending on why and how you are doing this one or the other is more useful.

I get it, you don't like "wasting" bunches of updates and the associated latches etc that are never going to actually be read. I don't like that either.

However - many people do NOT have thousands of connections that are continuously making thousands of db references and, for them, those considerations are not such a big deal. Keeping track of the most recent db reference is useful when you only look at these things *after* the problem has occurred (as is the case here) and when there is no opportunity to inject a request to retroactively tell you what was happening.

Personally, I'd like OpenEdge to *always* track the statement associated with every db reference. It does not have to be as painful as it currently is. IMHO the problem lies in *how* they gather and record the data. Locking the USR latch and sending the data as a distinct set of network messages is (again, IMHO) not very efficient. I think that they could do a much better job of it with a little thought. It just needs to be a priority for development to improve it.
 
@TomBascom
You know the customer of ours who taught me to be very careful about the code that is proposed to run in the production environment. :-)

Does anyone have a code to monitor the long running transactions they can share? Long transaction watchdog?
I know there is a simple code in Dan Foreman's book but I'm talking about a program that can get a client statement cache, _User* and _Trans VSTs.
It would be great if a program could monitor a few databases together and links the transactions to a process (host+PID) rather than to the connections (_Connect-Usr). I became old and completely lazy to write such code. ;-(
 
ProTop has such a watchdog.

We do not, however, do anything specific about multiple database situations. You are probably an exception but in our experience that kind of thing will occur in the "main" database first and foremost and it when we disconnect that session the others will follow. If they do not then additional steps are taken and additional alerts get generated.
 
Regarding the client statement cache and "3" vs "1"...

The problem that I have with using "3" to try to get to the bottom of a problem is that a lot of problematic code starts off with something like reading a control record. And then it dives into the more complex and problematic stuff. Worse, it might end with an update to such a record. So if you set the cache to "sample only once" you're going to see that control record at one end or the other (because you turned it on either before the code ran or after it had already started - so you miss the bad stuff since it is already underway) and it is probably in a very generic bit of code that tells you almost nothing about what was going on in the intense part of the process.

Whereas if you start tracking every statement for a session, then when you take a look while the problem is occurring you get to see what is actually happening. To me that is a lot more useful and worth the expense (within reason on the expense side -- see my previous comments about thousands of simultaneous connections).
 
Whereas if you start tracking every statement for a session, then when you take a look while the problem is occurring you get to see what is actually happening. To me that is a lot more useful and worth the expense (within reason on the expense side -- see my previous comments about thousands of simultaneous connections).
Disagree is my second name. :cool:

CachingType = 1 methord:
You set the value only once and check the statement cache serially - at t1, t2, t3 etc time. Let’s, every minute.
You will get the call stacks on all borders of stat intervals.

CachingType = 3 methord:
I set CachingType = 3 at t1 time.
I check the t1 statement cache at t2 time.
I re-set CachingType at t2 time.
etc

So I will get the call stacks at the beginning of each stat intervals.
I will not get it at the end of last stat interval. It’s the last interval because a program already made the decision to stop the process’ monitoring. The lack of the last stack is not a big issue then.

More interesting question is how to represent the series of the call stacks (at t1, t2, t3 etc moments of time).
I would find out the deepest level without the changes (neither CacheInfo nor CacheLineNumber). It’s a "path to".
Next level is the level of a guilty procedure.
I would check the most popular name on this level and its range of line numbers.
If CacheInfo on this level stays the same for the whole series - bingo!
Otherwise I would add the list of the rest procedures on the same level as an addition to the main name.
The levels below the guilty level can be ignored.
 
FWIW...

I think the difference here is that you are actively investigating something that you already know is a problem.

I am a bit more focused on diagnosing a situation that I didn't know about ahead of time.

Minor detail: you only get the top of the stack with type "1". You need type "2" for the full stack.
 
Hi George
More interesting question is how to represent the series of the call stacks (at t1, t2, t3 etc moments of time).
I would find out the deepest level without the changes (neither CacheInfo nor CacheLineNumber). It’s a "path to".
Next level is the level of a guilty procedure.
I would check the most popular name on this level and its range of line numbers.
I am using this type of function where I can select the user and the "activity" (Lock, access ,read on table index or lob) I want to analyze .
Each time the ativity of a user is above the threshold between Tx and Tx+1 (0.005 sec between them), I record its full call-satck (Tx and Tx+1)

I order the result in 3 categories
- "Top" , same call-stack (procedure and line at begining and at the end) (top.opng)
- "Medium" , same procedure but different line (medium.png)
- the other , different procedure betwwen begining at end.

This is very helpfull to find an issue
Patrice
 

Attachments

  • Select.png
    Select.png
    592.7 KB · Views: 2
  • medium.png
    medium.png
    642.6 KB · Views: 2
  • top.png
    top.png
    584.9 KB · Views: 2
Back
Top