Question Apw Writes Percentage (vst)

BigSlick

Member
Hi All,

On OE10.2BSP07, Windows 64bit.

I'm trying to determine if/when APW's are being stretched. Currently we have one running - I know this should be probably be more, I just need to justify it.

Currently within promon the 'Writes by APW' sits at a nice 98%, a sample of an hour is the same. Every so often this will drop to around 91%. But some of the stuff ive read says below 80% is an issue.

Using VST's is there a way to calculate the % that promon gives so i can analyse the data?

TIA
 

TomBascom

Curmudgeon
How is it that you know that you should probably have more?

1 APW is appropriate for almost everyone.

There are a *LOT* of very bad kbase entries floating around. If you are reading anything that suggests something like 1 APW per "disk" mark that entry as bogus and move on. (That advice sort of made sense for Progress v6 and the HW available in the early 90s.)

The usual suggested modern metric for "think about adding an APW" is flushing buffers at checkpoints. This is a sign that the APWs were not able to keep up with demand. If it happens consistently and if the number of buffers being flushed is significant (3 digits) then you should be looking at adding an APW. But first take a look at the time between checkpoints -- is it in seconds? Or minutes? If it is in seconds then the real problem is more likely that your bi cluster size is too small.

APW information is mostly in the _ActPWs VST.

VST programming can be tricky -- you might like to download and take a look at the source for ProTop. ProTop Version 3. The APW stuff is in dc/dashboard.p
 

BigSlick

Member
Thanks Tom.

Mainly the size of the database (1TB+), the growth (0.6G per day) and the activity suggest to me that only one APW is pushing it. Although during normal activity it does seem to perform well.

Checkpoints to me seem very good;

Code:
♀05/03/16        Checkpoints
13:09:08

Ckpt                                  ------ Database Writes ------
 No. Time        Len   Freq   Dirty   CPT Q    Scan   APW Q Flushes   Duration  Sync Time

1217 13:03:14    354      0  130048  123635     104    3230       0       1.05       0.06

1216 12:43:49   1148   1165  118387   36463   25948   84937       0       0.85       0.06
1215 12:25:20    955   1109  149471  145563   15444   19574       0       0.95       0.06
1214 12:03:36   1163   1304   99250   56177   23712   86055       0       1.09       0.06
1213 11:34:50   1704   1726  132125   69451   28652   87043       0       0.84       0.06
1212 11:08:57   1492   1553   38751   26945   33046   13128       0       0.91       0.07
1211 10:49:47   1133   1150   36109   36675   17628   93316       0       0.83       0.08
1210 10:14:47   2084   2100  192771   21228   41470  258114       0       0.86       0.08

The main issue comes when we are backing the database up and during some other activities. That's why i want to monitor is regularly to find peaks.
 

TomBascom

Curmudgeon
When you are backing up there is, of course, going to be doing a whole lot of IO. Adding more processes to try to push the IO harder is unlikely to improve anything ;)

Personally I think you need ProTop. I suggest the commercial version -- with fancy charts and graphs and alerts and stuff like that. I know someone...
 

Cringer

ProgressTalk.com Moderator
Staff member
ProTop is a great way of monitoring such things. I also know someone...
 

TomBascom

Curmudgeon
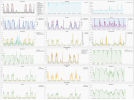
This is a week of data from 1TB db with about 1,800 users -- notice that the APW write % has its ups and downs. That's normal and it isn't cause for alarm -- the users are quite happy.

upload_2016-5-4_13-43-48.png
 

Cringer

ProgressTalk.com Moderator
Staff member
Oooh those are fancy graphs Tom. Very pretty. Nice to see what looks to be a correlation between the backups kicking in and a small drop off in APW write %.

Edit: In fact you can really see the impact of the backups on all sorts of the figures...
 
Top