
TheMadDBA
Active Member
Sounds like your vendor has an incredibly poor written application.... my condolences.
On the 32 bit/64 bit side... Progress has "fixed" this by making 64 bit servers and clients available quite some time ago. They expect vendors not to buy the wrong product for their clients, but sometimes they do. On the plus side all your would need is the new Progress server binaries. No DB conversion required. 32 bit clients connecting through TCPIP work just fine with 64 bit servers. No reason for your vendor to know/care about the server being 64 bit.
Spin: Every system and app is different, but I had -spin set at 2000 for a 4000+ user system.... but our code wasn't complete crap.
Checkpoints: When you say frequent checkpoints how often are we talking about? Unless it is every 30 seconds or less don't worry about that. What you need to worry about are buffers flushed at checkpoint.. that indicates a stall in DB activity while the checkpoint is happening. That would mean the cluster size needs to be increased and/or the number of APWs adjusted.
It appears you are at least running the Enterprise version but I didn't see any APWs started in the log file. Start 2 of them and the PROWDOG as well. APWs are background agents that write DB and BI activity to disk behind the scenes much like DB Writers do in Oracle. PROWDOG is basically a sanity checker that should be started by default, but for some reason Progress just doesn't.
SQL: Are users actually connecting through SQL or just through the 4GL/ABL applications? If they are using SQL make sure the statistics are current.
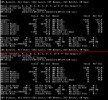
What does a promon -> R&D -> 2 -> 1 look like during peak times? 5 minute samples are good to start with.
On the 32 bit/64 bit side... Progress has "fixed" this by making 64 bit servers and clients available quite some time ago. They expect vendors not to buy the wrong product for their clients, but sometimes they do. On the plus side all your would need is the new Progress server binaries. No DB conversion required. 32 bit clients connecting through TCPIP work just fine with 64 bit servers. No reason for your vendor to know/care about the server being 64 bit.
Spin: Every system and app is different, but I had -spin set at 2000 for a 4000+ user system.... but our code wasn't complete crap.
Checkpoints: When you say frequent checkpoints how often are we talking about? Unless it is every 30 seconds or less don't worry about that. What you need to worry about are buffers flushed at checkpoint.. that indicates a stall in DB activity while the checkpoint is happening. That would mean the cluster size needs to be increased and/or the number of APWs adjusted.
It appears you are at least running the Enterprise version but I didn't see any APWs started in the log file. Start 2 of them and the PROWDOG as well. APWs are background agents that write DB and BI activity to disk behind the scenes much like DB Writers do in Oracle. PROWDOG is basically a sanity checker that should be started by default, but for some reason Progress just doesn't.
SQL: Are users actually connecting through SQL or just through the 4GL/ABL applications? If they are using SQL make sure the statistics are current.
What does a promon -> R&D -> 2 -> 1 look like during peak times? 5 minute samples are good to start with.
")