Question Java Script Help - To pass a records data

Give some idea how can I achieve this.
Please have a look into the attached code. Everything working fine as expected. However I populate 3 records in a temp-table. Please see the For Each loop we are calling the function drawBar.
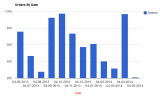
Graph is appearing fine but it appear as single Bar for the first record 05/01/2014 (then it disappear) , then for second record and finally third . Only I can see the last (3rd) record data in Graph .

How can I pass the entire record set into that function. So that I can see three bars. Give some ideas.

-Philip-
 

Attachments

  • barnew.txt
    2.2 KB · Views: 4

Cecil

19+ years progress programming and still learning.
My first guess is that you have the Javascript inside the FOR EACH loop. Try moving the javascript code after the END statement of the FOR EACH and build up a single string as an array.

Also check out highcharts.

TRY THIS (I have not tested so it might have a few bugs.):

Code:
PROCEDURE call-Bar:
   
    Create tfOrderData.
    Assign
      tfOrderData.OrderDate = 05/01/2014
      tfOrderData.OrderNum = 1000.
    Create tfOrderData.
    Assign
      tfOrderData.OrderDate = 05/02/2014
      tfOrderData.OrderNum = 1170.
     Create tfOrderData.
    Assign
      tfOrderData.OrderDate = 05/03/2014
      tfOrderData.OrderNum = 660.

def var dataArray AS CHARACTER. 

FOR EACH  tfOrderData
BREAK BY tfOrderData.OrderDate:

dataArray = dataArray + SUBSTITUTE("['&1' , &2]",
tfOrderData.OrderDate,
tfOrderData.OrderNum)

IF NOT LAST(tfOrderData.OrderDate) THEN 
dataArray = dataArray + ','.

END.

/** Error trap if there are no TEMP-TABLE records.**/
IF TEMP-TABLE tfOrderData:HAS-RECORDS EQ FALSE THEN
dataArray = [].

<!-- DEBUG MESSAGE inside the HTML-->
{&OUT } '<p>'  + dataArray +  '</p>' SKIP.

  {&OUT} "<script language='JavaScript' type='text~/JavaScript'>" SKIP.
   {&OUT} SUBSTITUTE("drawBar(&1);", QUOTER(dataArray) SKIP. 
   {&OUT} "<~/script>" SKIP.

Code:
    <script type="text/javascript"> 
      google.load("visualization", "1", {packages:["corechart"]}); 
      google.setOnLoadCallback(drawBar); 
      function drawBar(vDataArray) { 
        //document.write(vDataString); 
       //alert(vCol11);
       //alert(vCol12);
console.debug(vDataArray);
        var data = google.visualization.arrayToDataTable([ 
                   ['Date', 'Orders'], 
                   vDataArray,                                                                                       
                   ]); 

        var options = { 
          title: 'Orders By Date', 
          hAxis: {title: 'Date', titleTextStyle: {color: 'red'}} 
        }; 

        var chart = new google.visualization.ColumnChart(document.getElementById('bar_div')); 
        chart.draw(data, options); 
      } 

    </script>
 

Cecil

19+ years progress programming and still learning.
Ignore what I said it's all wrong.
I think you might be getting your self confused in which the order of how WebSpeed Code is executed.

Here is the corrected and working code:

Code:
<script language="speedscript">
Def temp-table tfOrderData
  FIELD OrderDate as Date
  Field OrderNum As Int.

PROCEDURE call-Bar:
 
    def var dataArray AS CHARACTER NO-UNDO.
    DEFINE VARIABLE in_Loop AS INTEGER     NO-UNDO.

    DO in_Loop = 1 TO 12:
      
        Create tfOrderData.

        Assign
          tfOrderData.OrderDate = ADD-INTERVAL(TODAY, (in_Loop * -1), 'Months' ).
          tfOrderData.OrderNum = RANDOM(100,1000).

    END.

    FOR EACH  tfOrderData
        BREAK BY tfOrderData.OrderDate:
   
        dataArray = dataArray + SUBSTITUTE('["&1",&2]',
                                           STRING(tfOrderData.OrderDate,"99-99-9999") ,
                                           tfOrderData.OrderNum).
       
        IF NOT LAST(tfOrderData.OrderDate) THEN
            dataArray = dataArray + ',~r~n'.
   
    END.
   
    /** Error trap if there are no TEMP-TABLE records.**/
    IF TEMP-TABLE tfOrderData:HAS-RECORDS EQ FALSE THEN
        dataArray = '[]'.

    set-user-field('chartDataArray', dataArray).
 
END PROCEDURE. /* ? */


PROCEDURE Output-HEADERS:
    RUN call-Bar IN THIS-PROCEDURE.

    /** Here you can place cookies here.**/
END PROCEDURE.

/** REMEMBER, WebSpeed Code is executed on the Server**/
</script>

<html>
  <head>
    <script type="text/javascript" src="https://www.google.com/jsapi"></script>
    <script type="text/javascript">
      google.load("visualization", "1", {packages:["corechart"]});

      google.setOnLoadCallback(drawBar);

      function drawBar() {
          
          /* Calls the WebSpeed get-user-field function. See FIREBUG for more details. */
          console.debug(`get-user-field('chartDataArray')`);

        //document.write(vDataString);
       //alert(vCol11);
       //alert(vCol12);
        var data = google.visualization.arrayToDataTable([
                   ['Date', 'Orders'],
                   `get-user-field('chartDataArray')`
                   ]);

        var options = {
          title: 'Orders By Date',
          hAxis: {title: 'Date', titleTextStyle: {color: 'red'}}
        };
        var chart = new google.visualization.ColumnChart(document.getElementById('bar_div'));
        chart.draw(data, options);
      }
    </script>
  </head>

    <!-- DEBUG MESSAGE inside the HTML See WebSpeed Manual for get-user-field function.-->
    <p> `get-user-field('chartDataArray')` </p>

  <body>
    <div id="bar_div" style="width: 900px; height: 500px;"></div>
   
  </body>
</html>

GOOGLECHARTDEMO_HTML.png
 

Cringer

ProgressTalk.com Moderator
Staff member
Ah this takes me back... not done Webspeed for yonks. Last project I remember working on involved using Webspeed to generate dynamic javascript which in turn generated dynamic html. My head still hurts thinking about it. Worked a treat though when it was done! The screen in question became suddenly usable.
 
Thanks a lot for this solution. When I ran the above code as it is I got an output as follows. Please see the attached code.
["06-04-2013",280], ["07-04-2013",541], ["08-04-2013",291], ["09-04-2013",422], ["10-04-2013",101], ["11-04-2013",335], ["12-04-2013",496], ["01-04-2014",336], ["02-04-2014",768], ["03-04-2014",116], ["04-04-2014",178], ["05-04-2014",410]. Not the graph.
Any code to be added. Any mistakes I did.

-Philip-
 

Attachments

  • bar_new.txt
    2.3 KB · Views: 1

Cecil

19+ years progress programming and still learning.
Thanks a lot for this solution. When I ran the above code as it is I got an output as follows. Please see the attached code.
["06-04-2013",280], ["07-04-2013",541], ["08-04-2013",291], ["09-04-2013",422], ["10-04-2013",101], ["11-04-2013",335], ["12-04-2013",496], ["01-04-2014",336], ["02-04-2014",768], ["03-04-2014",116], ["04-04-2014",178], ["05-04-2014",410]. Not the graph.
Any code to be added. Any mistakes I did.

-Philip-
This was just debugging the character array, it's not an error. The best tool to have for debugging JavaScript if FireBug for Firefox. It will tell you where there errors are.
 

Cecil

19+ years progress programming and still learning.
Ironically it could be the debug message which is causing you problems Find the line : console.debug(`get-user-field('chartDataArray')`); Try commenting/deleting this line.
 
Top