Question Which Db Parameters To Change On New More Powerful Server?

Vito

New Member
Hello all,

Thanks God, we've got more powerful than what I have now Dell PowerEdge R720 with 256GB of RAM, 8 SSDs and 48 cores (2 CPUs * 12 cores each * 2 virtual) with 10Gbs NICs :)

Created RAID-10, tuned XFS, created LACP with two NICs, also tuned together with switch, so got 18-19Gbs between two servers.

Now main question:
Which DB-startup parameters shall I adjust in conmgr.properties and ubroker.propertiesfile to better utilize all these HW-resources?

We have 12 active Progress 11.7 databases running on the box, two of them are highly loaded.
An average daily number of client connections is 250-300.

We also have 15 app-servers

I increased sharedmemorysegmentsize to the maximum 32768.
What else can be changed/adjusted to start using this Dell in full?
 

Rob Fitzpatrick

ProgressTalk.com Sponsor
It's difficult to say what you should change based on the little we know. We don't know your OS but I guess it's some Linux; but you're also using OEM or OEE? We don't know the specs of your old hardware that you're migrating from. We don't know which OE version you're upgrading from, and therefore which new features and tuning options you now have access to for the first time.

Tuning DB broker startup parameters can help to minimize or eliminate bottlenecks on a per-database basis. But you have 12 databases, and we have no idea of their sizes, their relative I/O load, their relative write or read workloads, or their relative importance to the application(s).

We don't know what "highly loaded" means to you. Lots of users? Lots of writes? Lots of reads? Reads of what -- small reference tables? Large history tables?

Curious as to why -shmsegsize was your first change and why 32 GB?

I couldn't even begin to guess what changes could be beneficial until you provide a lot more details and answers.
 

Rob Fitzpatrick

ProgressTalk.com Sponsor
Maybe instead of attacking this from the perspective of "which knobs should I turn", you should instead think in practical terms of "what are the business problems or user complaints that I need to address, and in which order?" Then worry about additional tweaking once those issues are dealt with.

There is also the possibility that this is a more complicated tuning exercise than can be accomplished in a forum setting. Depending on what you want to accomplish, and your timeline and budget, you may want to consider hiring a consultant.
 

Cringer

ProgressTalk.com Moderator
Staff member
Completely agree with Rob. At least tell us where you're coming from, and what the 'problems' are you're trying to resolve.
So a list of hardware for the old system, along with the current DB startup params would be good.
The basics should also be covered. What Progress version? Are you running Type II storage? Probably plenty of others. I Can' think righ tnow.
 

Vito

New Member
Sorry guys,
I will give you move input.

Now we have Progress 11.5, migrating to 11.7
Total size of all databases ~ 400GB

Current Hardware: some old IBM Blade, 2 CPUs * 8 cores, RAM 128GB, local HDD: Mirrored 140GB
It has couple 1Gbs NICs, theu couldn't be bonded because of IBM chassis limitations.

Now all DBs reside on NetApp SAN.
Current OS: SUSE 11 SP4


On the new Server I've installed RedHat 7.3


I didn't start the migration yet, just planning.
Decided to increase sharedmemorysegmentsize since I got twice more memory, so why not to use it?

On the new server all DBs will reside locally on RAID-10 buit from 8 SSDs
 

Rob Fitzpatrick

ProgressTalk.com Sponsor
Decided to increase sharedmemorysegmentsize since I got twice more memory, so why not to use it?
With that change alone, you aren't using it. The -shmsegsize parameter determines the maximum size of the shared memory segment(s) allocated by the broker. So this parameter can be useful, for example, in a federated application where a client needs to connect to two or more databases and map all of their shared memory segments into the free spaces in its address space. But this really shouldn't be a problem in 64-bit OpenEdge.

Note from the documentation:
• If -shmsegsize is omitted, OpenEdge attempts to fit all shared memory into the fewest
segments possible.
• If the total shared memory required is smaller than the value specified with -shmsegsize,
only the required amount is allocated.
In other words, if your objective is to reduce the number of shared memory segments for a database or for the server as a whole, just don't specify -shmsegsize at all. Also, the large majority of shared memory is typically the amounts allocated to the buffer pools. If -B is small, and -B2 is small or zero, then shared memory will be correspondingly small, no matter how much RAM you have or how you have set -shmsegsize.

Now that you have more RAM, one might guess that you may benefit from increasing -B or utilizing the Alternate Buffer Pool in one or more of your databases. But you also may not. If your application has been running for a year and a given DB has half of its buffers still empty, increasing -B won't improve performance. It will simply waste more RAM. On the other hand, if it has no empty buffers, increasing -B (I mean a substantial change, not a small one) may improve the ratio of logical to physical I/O and help increase application performance and lower physical I/O load.

The important point is that analysis of performance metrics from your existing databases is required to determine what to change and how to change it and what benefit you should expect from the change. There is only so much that can be done remotely, with limited second-hand information, even with the best of intentions.

It would be helpful for you to post your broker startup parameters from your "highly loaded" pair of databases, i.e. the sections of the database logs from the last (333) message to the following (10471) message, together with the size of each DB in GB. Also post information about your BI and AI configuration. We can then at least offer suggestions if anything looks really out of whack.
 

Vito

New Member
Here is params for one of them, which is bigger and more busy than other ones

Code:
[configuration.somedb.main]
  afterimagebuffers=300
  afterimageprocess=true
  archivaldir=/somearchivedir
  archivalinterval=3600
  asynchronouspagewriters=4
  beforeimagebuffers=300
  beforeimageprocess=true
  blocksindatabasebuffers=13000000
  database=market
  displayname=main
  locktableentries=150000
  maxservers=45
  maxusers=190
  monitored=true
  otherargs=-DBService replserv -h 10
  servergroups=somedb.main.4gl, somedb.main.sql
  sharedmemorysegmentsize=32768
  spinlockretries=40000
  watchdogprocess=true

[servergroup.somedb.main.4gl]
  configuration=somedb.main
  displayname=4gl
  maxclientsperserver=5
  maxdynamicport=50300
  mindynamicport=50100
  numberofservers=35
  messagebuffersize=4096
  port=50001
  type=4gl

[servergroup.somedb.main.sql]
  configuration=somedb.main
  displayname=sql
  maxclientsperserver=2
  maxdynamicport=50350
  mindynamicport=50300
  numberofservers=8
  port=51001
  type=sql

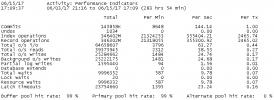
And this is an output of PROMON

upload_2017-6-15_16-53-47.png
 

Rob Fitzpatrick

ProgressTalk.com Sponsor
I would have preferred the DB log view of the parameters, which is why I asked for that. ;)

Your -B is 13 million. What is your database block size? if it's 4 KB, you have 49.6 GB of -B for a 53 GB database. If it's 8 KB then you're wasting a lot of RAM, so I'll give you the benefit of the doubt and assume it's 4 KB. Either way, I wouldn't expect the extra RAM to help you too much right now.

Four APWs is very likely more than you need. I would guess two would be plenty; maybe even one.

AI is enabled; that's good. :)

I suspect this application has had some "challenges" in the past, like transaction scoping, given a -L of 150,000 and -n of 190, and also a BI size of 6.8 GB.

I see you're using OE Replication; I hope you are upgrading the DR server as well. What is your setting for -pica?

Your resource and latch timeouts seem high to me. I'd hazard a guess that your LRU latch is the most or one of the most frequently accessed. If you haven't already, add -lruskips 100. Also look at -omsize, and increase it if it is smaller than the number of records in _StorageObject. Those are two easy, low-risk optimizations for reducing latch locking.
 

cj_brandt

Active Member
As Rob stated - its hard to give recommendations to fix or correct a problem, when we don't know what the problem is. Just that you now have faster hardware and more memory.

If you want to use more memory, increase the -B parameter and maybe start using the Alternate Buffer Pool - B2.
I would set the spin parameter around 50,000 and leave it alone.

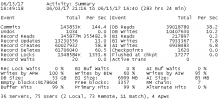
I would recommend showing the promon screens for 10 - 30 seconds during a time when the system is heavily used - not a 284 hour window.

A few promon screens to get you started 5; R&D 1 9; R&D 2 5; R&D 3 1.
 

Rob Fitzpatrick

ProgressTalk.com Sponsor
Looks like it makes sense to increase spinlockretries from 40000 to what Progress recommends 10,000 * # of CPUs, so to 480,000 in my case
Please don't! Especially on a multi-core box like that. The default for -spin hasn't changed in quite some time, and hardware has changed a lot since then. If anything, you might want to reduce -spin a bit, but I can't say without seeing your metrics. It's really dependent on your application workload. But definitely don't use the default for -spin.
 

Vito

New Member
Here are my all DB startup params from promon (DB log was purged and archived, so it's faster to get them from PROMON)

After-image Management Archival Directory List (-aiarcdir): /somedir
Create After-image Management Archival Directory(s) (-aiarcdircreate): Not Enabled
After-image Management Archival Interval (-aiarcinterval): 3600
Number of After-Image Buffers (-aibufs): 300
After-Image Stall (-aistall): Enabled
Starting index number for statistics range (-baseindex): 1
Starting table number for statistics range (-basetable): 1
Number of Before-Image Buffers (-bibufs): 300
BI File Threshold Stall (-bistall): Disabled.
BI File Threshold size (-bithold): 0.0 Bytes
Database Blocksize (-blocksize): 4096
BIW writer delay (-bwdelay): 0
Allowed index cursors (-c): 764.
SSL Certificate Store Path (-certstorepath): Not Enabled
Character Set (-cpinternal): iso8859-1
Physical Database Name (-db): /dbdir/dbname
Direct I/O (-directio): Not Enabled
Database Type (-dt): PROGRESS
Encryption cache size (-ecsize): 1000
Group delay (-groupdelay): 10
Hash Table Entries (-hash): 3985057
Crash Recovery (-i): Enabled
Number of indexes included in statistics collection (-indexrangesize): 50
TCP/IP Version (-ipver): Not Enabled
SSL Key Alias Name (-keyalias): Not Enabled
Lock table hash table size (-lkhash): 25621
Original Lock Release Algorithm (-lkrela): Not Enabled
Number of LRU force skips (-lruskips): 0
Number of LRU2 force skips (-lru2skips): 0
Maximum Area Number (-maxArea): 32000
Size of JTA transaction table (-maxxids): 100
Maximum Port for Auto Servers (-maxport): 30970
Minimum Port for Auto Servers (-minport): 30801
Multi-tenancy partition cache size (-mtpmsize): 1024
Use muxlatches (-mux): 1
Maximum Number of Users (-n): 191
Minimum time to nap at first -spin exhaustion (-nap): 10
Maximum time to nap at -spin exhaustion (-napmax): 250
No SSL Session Cache (-nosessioncache): Not Enabled
Disable LRU mechanism (-nolru): Not Enabled
Login Governor (-nGovernor): 0 of 191
Storage object cache size (-omsize): 1024
Database Service Manager - IPC Queue Size (-pica): 64.0 KBytes
Shared memory segments locked (-pinshm): Not Enabled
Use pollset mechanism for client/server (-pollset): Not Enabled
Delay first prefetch message (-prefetchDelay): Not Enabled
Prefetch message fill percentage (-prefetchFactor): 0
Minimum records in prefetch msg (-prefetchNumRecs): 16
Suspension queue poll priority (-prefetchPriority): 0
APW queue scan cycle time in milliseconds (-pwqdelay): 100
APW minimum queue length before write (-pwqmin): 1
APW buffer scan cycle time in seconds (-pwsdelay): 1
APW maximun number of buffers to scan per cycle (-pwscan): 21666
APW maximum number of buffers to write per cycle (-pwwmax): 25
Before-Image File I/O (-r -R): Reliable
Record free chain search depth factor (-recspacesearchdepth): 5
Number of Semaphore Sets (-semsets): 3
SSL Session Timeout (-sessiontimeout): 0
Maximum Shared Memory Segment Size (-shmsegsize): 0 Mb
Current Spin Lock Tries (-spin): 40000
SSL Encryption for TCP/IP connections (-ssl): Not Enabled
Number of tables included in statistics collection (-tablerangesize): 50
Area block consistency check (-AreaCheck): Not Enabled
Number of Database Buffers (-B): 13000000
Number of Alternate Database Buffers (-B2): 0
Maximum private buffers per user (-Bpmax): 64
Database block consistency check (-DbCheck): Not Enabled
Database Service Manager - Service(s) to start (-DBService): replserv,replserv
Enhanced Read-Only mode (-ERO): Not Enabled
Force Access (-F): Not Enabled
Before-Image Truncate Interval (-G): 0
Host Name (-H): Not Enabled
Index block consistency check (-IndexCheck): Not Enabled
Current Size of Lock Table (-L): 150016
Lock Governor (-LGovernor): 0%
Maximum Number of Clients Per Server (-Ma): 5
Memory overwrite check (-MemCheck): Not Enabled
Delay of Before-Image Flush (-Mf): 3
Minimum Clients Per Server (-Mi): 1
Message Buffer Size (-Mm): 4096
Maximum Number of Servers (-Mn): 46
Servers per Protocol (-Mp): 0
Maximum Servers Per Broker (-Mpb): 35
Excess Shared Memory Size (-Mxs): 108
Network Type (-N): TCP
Server network message wait time (-Nmsgwait): 2
Pending client connection timeout (-PendConnTimeout): 0
Service Name (-S): someportnumber
Broker server group support (-ServerType): ABL
SQL Server Max Open Cursors (-SQLCursors): 0
SQL Server Stack Size (-SQLStack): 0
SQL Server Statement Cache Size (-SQLStmtCache): 0
Size [1K byte units] of SQL Server temp table buffer (-SQLTempStoreBuff): 0
Size [1K byte units] of SQL Server temp table disk storage (-SQLTempStoreDisk): 0
Size [1K byte units] of SQL Server temp table data page (-SQLTempStorePageSize): 0
Authorized data truncation (-SQLTruncateTooLarge): OFF
Record block consistency check (-TableCheck): Not Enabled
TXE Lock retry limit (-TXERetryLimit): 0
TXE Commit lock skip limit (-TXESkipLimit): 10000
 

Cringer

ProgressTalk.com Moderator
Staff member
(DB log was purged and archived, so it's faster to get them from PROMON)
If you use prolog to purge the log files then the DB startup parameters are written back to the log. I think this was introduced in 11.3. It was somewhere around that time anyway.
 

cj_brandt

Active Member
One change that will help track the activity of the database, is to increase
Number of indexes included in statistics collection (-indexrangesize): 50
Number of tables included in statistics collection (-tablerangesize): 50

Get the number of user tables and their indexes and then update the values above. This will allow the db to track the table / index activity.

One change that will help reduce latch contention when reading records.
Number of LRU force skips (-lruskips): 0
and if you decide to use the alternate buffer pool.
Number of LRU2 force skips (-lru2skips): 0
I usually set the initial value at 100.

Another value to update to help reduce latch contention
Storage object cache size (-omsize): 1024
set this to the number of objects in your db - there is a KB article on computing this.

if you have extra memory on the host, you can increase these
Number of Database Buffers (-B): 13000000
Number of Alternate Database Buffers (-B2): 0
 

Vito

New Member
Thank you, guys!
Let me analyze all the metrics one by one :)
1) blocksindatabasebuffers (-B)
echo -e "R&D\n1\n7" | promon /mydb 2>/dev/null

06/16/17 Status: Buffer Cache
10:01:31
Total buffers: 13,000,002
Hash table size: 3985057
Used buffers: 2,954,845
Empty buffers: 10,045,157
On lru chain: 13000000
On lru2 chain: 0
On apw queue: 0
On ckp queue: 0
Modified buffers: 1623
Marked for ckp: 0
Last checkpoint number: 1761
LRU force skips: 0
LRU2 force skips: 0

Looks like, vast majority of those buffers are not in use. So instead of 13mln I can set let's say 6, and it should be enough.

2) alternatebufferpool (-B2)
Shall I change it from current 0 (Zero) to something? Let's say, reduce blocksindatabasebuffers (-B) to 4mln and set alternatebufferpool (-B2) to 2mln ?
 

Vito

New Member
By the way, guys, anybody knows what's the "full parameter name" of -lruskips and -lru2skips ?
Examples: beforeimageclusterage for -G, maxusers for -n, etc

I'm asking that because when you start DB with proserve -servergroup dbname.servergroup -m5 it ignores everything wht's in otherargs= section
 
Last edited:

Cringer

ProgressTalk.com Moderator
Staff member
-B2 you should always size based on what you're putting in it. If the schema area is clear of data and indexes then it's a no brainer to put it in (you can do this from the command line), and it doesn't take up much space at all. Other candidates for the secondary buffer pool are small static tables that are read frequently. You should put them, and their associated indexes into the secondary buffer pool. This has to be done through the data administration window though.
IMO you shouldn't set -lruskips2 because it will only come into play if you're putting more stuff in -B2 than there is space for it, and that almost negates the point of -B2. -B2 is the secondary buffer pool and you want stuff in there to be permanently resident in memory.
 

Vito

New Member
Hi Cringer, could you please explain me quickly, how do you put some objects (tables, indexes) into the secondary buffer pool using Data Admin tool?

Is it in "Data dictionary" -> "Admin" -> "Alternate Buffer Pool" -> "Alternate Buffer Pool Maintenance", right?

You just assign objects and direct them to Primary or Alternate pool?
 
Last edited:
Top