Shanmugam T
New Member
Hi All,
I got downtime and performed dump & load successfully. Also migrated to Type 2 storage. there was no performance issue reported from user. Jan month end closing was peaceful") .
.
However i have challenges on resource part as well.
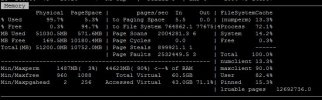
1) RAM utilization is almost 100% for past two months (shown in server performance report graph).
2) During peak load (month end), 11 CPU's were utilized.
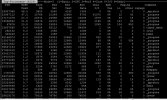
3) Topas utility shows 50 to 60% of CPU were utilized by user processes.
Server Config: IBM AIX 6.1, 14 CPU's and 50GB RAM.
Total no of users: 1800 during monthend on server level
I have pasted db activity and buffer cache status below (15 minutes interval). Kindly suggest me do i still need to increase -B value for this database.
Apart from this database, we have few more databases running on the same server ( Two are 100 GB of size and rest all less than 15 GB of size ).
DB activity
Activity - Sampled at 02/06/15 14:17 for 107:52:22.
Event Total Per Sec Event Total Per Sec
Commits 21611991 55.7 Undos 63368 0.2
Record Updates 11794056 30.4 Record Reads 29865703177 76905.7
Record Creates 4125734 10.6 Record Deletes 2498914 6.4
DB Writes 1494455 3.8 DB Reads 188904951 486.4
BI Writes 1159342 3.0 BI Reads 117846 0.3
AI Writes 862839 2.2
Record Locks 125405719 322.9 Record Waits 461 0.0
Checkpoints 763 0.00 Buffs Flushed 5365 0.0
Rec Lock Waits 0 % BI Buf Waits 0 % AI Buf Waits 0 %
Writes by APW 96 % Writes by BIW 51 % Writes by AIW 90 %
Buffer Hits 100 %
DB Size 130 GB BI Size 6143 MB AI Size 49 MB
FR chain 2112 blocks RM chain 2 blocks
Shared Memory 4198M Segments 1
4 Servers, 447 Users (446 Local, 1 Remote, 0 Batch),5 Apws
-----------------------------------------------------------------------------------------------
Activity - Sampled at 02/06/15 14:31 for 108:07:01.
Event Total Per Sec Event Total Per Sec
Commits 21628552 55.6 Undos 63525 0.2
Record Updates 11802596 30.3 Record Reads 29937300983 76915.9
Record Creates 4129951 10.6 Record Deletes 2500505 6.4
DB Writes 1495715 3.8 DB Reads 189225870 486.2
BI Writes 1160689 3.0 BI Reads 117862 0.3
AI Writes 863697 2.2
Record Locks 125484396 322.4 Record Waits 462 0.0
Checkpoints 764 0.00 Buffs Flushed 5365 0.0
Rec Lock Waits 0 % BI Buf Waits 0 % AI Buf Waits 0 %
Writes by APW 96 % Writes by BIW 51 % Writes by AIW 90 %
Buffer Hits 100 %
DB Size 130 GB BI Size 6143 MB AI Size 9328 K
FR chain 2112 blocks RM chain 2 blocks
Shared Memory 4198M Segments 1
4 Servers, 450 Users (449 Local, 1 Remote, 0 Batch),5 Apws
-----------------------------------------------------------------------------------------------
Activity - Sampled at 02/06/15 14:50 for 108:25:20.
Event Total Per Sec Event Total Per Sec
Commits 21639443 55.4 Undos 63741 0.2
Record Updates 11812133 30.3 Record Reads 30035980761 76952.2
Record Creates 4133723 10.6 Record Deletes 2501902 6.4
DB Writes 1499017 3.8 DB Reads 189531990 485.6
BI Writes 1162059 3.0 BI Reads 117895 0.3
AI Writes 864585 2.2
Record Locks 125570571 321.7 Record Waits 464 0.0
Checkpoints 764 0.00 Buffs Flushed 5365 0.0
Rec Lock Waits 0 % BI Buf Waits 0 % AI Buf Waits 0 %
Writes by APW 96 % Writes by BIW 51 % Writes by AIW 90 %
Buffer Hits 100 %
DB Size 130 GB BI Size 6143 MB AI Size 18 MB
FR chain 2112 blocks RM chain 2 blocks
Shared Memory 4198M Segments 1
4 Servers, 449 Users (447 Local, 2 Remote, 1 Batch),5 Apws
--------------------------------------------------------
02/06/15 Status: Buffer Cache
14:17:38
Total buffers: 500002
Hash table size: 137743
Used buffers: 500002
Empty buffers: 0
On lru chain: 500001
On apw queue: 0
On ckp queue: 483
Modified buffers: -7652
Marked for ckp: 483
Last checkpoint number: 767
02/06/15 Status: Buffer Cache
14:32:15
Total buffers: 500002
Hash table size: 137743
Used buffers: 500002
Empty buffers: 0
On lru chain: 500001
On apw queue: 0
On ckp queue: 2111
Modified buffers: -7032
Marked for ckp: 2111
Last checkpoint number: 768
Enter <return>, R, P, T, or X (? for help):
02/06/15 Status: Buffer Cache
14:50:38
Total buffers: 500002
Hash table size: 137743
Used buffers: 500002
Empty buffers: 0
On lru chain: 500001
On apw queue: 0
On ckp queue: 218
Modified buffers: -7766
Marked for ckp: 218
Last checkpoint number: 768
-----------------------------------------------------------------------------------------------
Thanks everyone for helping me.
Awaiting for your response.
-Rgs
Shan
I got downtime and performed dump & load successfully. Also migrated to Type 2 storage. there was no performance issue reported from user. Jan month end closing was peaceful
.However i have challenges on resource part as well.
1) RAM utilization is almost 100% for past two months (shown in server performance report graph).
2) During peak load (month end), 11 CPU's were utilized.
3) Topas utility shows 50 to 60% of CPU were utilized by user processes.
Server Config: IBM AIX 6.1, 14 CPU's and 50GB RAM.
Total no of users: 1800 during monthend on server level
I have pasted db activity and buffer cache status below (15 minutes interval). Kindly suggest me do i still need to increase -B value for this database.
Apart from this database, we have few more databases running on the same server ( Two are 100 GB of size and rest all less than 15 GB of size ).
DB activity
Activity - Sampled at 02/06/15 14:17 for 107:52:22.
Event Total Per Sec Event Total Per Sec
Commits 21611991 55.7 Undos 63368 0.2
Record Updates 11794056 30.4 Record Reads 29865703177 76905.7
Record Creates 4125734 10.6 Record Deletes 2498914 6.4
DB Writes 1494455 3.8 DB Reads 188904951 486.4
BI Writes 1159342 3.0 BI Reads 117846 0.3
AI Writes 862839 2.2
Record Locks 125405719 322.9 Record Waits 461 0.0
Checkpoints 763 0.00 Buffs Flushed 5365 0.0
Rec Lock Waits 0 % BI Buf Waits 0 % AI Buf Waits 0 %
Writes by APW 96 % Writes by BIW 51 % Writes by AIW 90 %
Buffer Hits 100 %
DB Size 130 GB BI Size 6143 MB AI Size 49 MB
FR chain 2112 blocks RM chain 2 blocks
Shared Memory 4198M Segments 1
4 Servers, 447 Users (446 Local, 1 Remote, 0 Batch),5 Apws
-----------------------------------------------------------------------------------------------
Activity - Sampled at 02/06/15 14:31 for 108:07:01.
Event Total Per Sec Event Total Per Sec
Commits 21628552 55.6 Undos 63525 0.2
Record Updates 11802596 30.3 Record Reads 29937300983 76915.9
Record Creates 4129951 10.6 Record Deletes 2500505 6.4
DB Writes 1495715 3.8 DB Reads 189225870 486.2
BI Writes 1160689 3.0 BI Reads 117862 0.3
AI Writes 863697 2.2
Record Locks 125484396 322.4 Record Waits 462 0.0
Checkpoints 764 0.00 Buffs Flushed 5365 0.0
Rec Lock Waits 0 % BI Buf Waits 0 % AI Buf Waits 0 %
Writes by APW 96 % Writes by BIW 51 % Writes by AIW 90 %
Buffer Hits 100 %
DB Size 130 GB BI Size 6143 MB AI Size 9328 K
FR chain 2112 blocks RM chain 2 blocks
Shared Memory 4198M Segments 1
4 Servers, 450 Users (449 Local, 1 Remote, 0 Batch),5 Apws
-----------------------------------------------------------------------------------------------
Activity - Sampled at 02/06/15 14:50 for 108:25:20.
Event Total Per Sec Event Total Per Sec
Commits 21639443 55.4 Undos 63741 0.2
Record Updates 11812133 30.3 Record Reads 30035980761 76952.2
Record Creates 4133723 10.6 Record Deletes 2501902 6.4
DB Writes 1499017 3.8 DB Reads 189531990 485.6
BI Writes 1162059 3.0 BI Reads 117895 0.3
AI Writes 864585 2.2
Record Locks 125570571 321.7 Record Waits 464 0.0
Checkpoints 764 0.00 Buffs Flushed 5365 0.0
Rec Lock Waits 0 % BI Buf Waits 0 % AI Buf Waits 0 %
Writes by APW 96 % Writes by BIW 51 % Writes by AIW 90 %
Buffer Hits 100 %
DB Size 130 GB BI Size 6143 MB AI Size 18 MB
FR chain 2112 blocks RM chain 2 blocks
Shared Memory 4198M Segments 1
4 Servers, 449 Users (447 Local, 2 Remote, 1 Batch),5 Apws
--------------------------------------------------------
02/06/15 Status: Buffer Cache
14:17:38
Total buffers: 500002
Hash table size: 137743
Used buffers: 500002
Empty buffers: 0
On lru chain: 500001
On apw queue: 0
On ckp queue: 483
Modified buffers: -7652
Marked for ckp: 483
Last checkpoint number: 767
02/06/15 Status: Buffer Cache
14:32:15
Total buffers: 500002
Hash table size: 137743
Used buffers: 500002
Empty buffers: 0
On lru chain: 500001
On apw queue: 0
On ckp queue: 2111
Modified buffers: -7032
Marked for ckp: 2111
Last checkpoint number: 768
Enter <return>, R, P, T, or X (? for help):
02/06/15 Status: Buffer Cache
14:50:38
Total buffers: 500002
Hash table size: 137743
Used buffers: 500002
Empty buffers: 0
On lru chain: 500001
On apw queue: 0
On ckp queue: 218
Modified buffers: -7766
Marked for ckp: 218
Last checkpoint number: 768
-----------------------------------------------------------------------------------------------
Thanks everyone for helping me.
Awaiting for your response.
-Rgs
Shan