Question Configuration of OE Explorer 11.4

Hi to All,

Window OS : Windows 2008 R2
OE : 11.4

Just want to ask how to configure the OE explorer because of it's slowness application loading, if we double click the Application Icon it takes 30s - 1m before it will open and ask of log-in account, then after that it will take again another 30s to load the Menu.

Hope someone can help us to configure the explorer, i strongly believe that it is on the explorer problem only.

I already truncated the BI and rebuild the index.

Thanks in advance
 

Cringer

ProgressTalk.com Moderator
Staff member
Truncating the BI and rebuilding indexes will have no effect on how quickly OE Explorer loads.
In your C:\OpenEdge\Wrk directory (or wherever you chose for that location on install) you will have an admserv.log is there anything pertinent in there? How about in today's log in C:\OpenEdge\wrk_oemgmt\logs?
 

Rob Fitzpatrick

ProgressTalk.com Sponsor
When you say "the application" do you mean the OpenEdge-based business application that uses this configuration, or OpenEdge Explorer itself?

Based on this configuration, I assume this is not a production environment. It almost looks like someone has gone out of their way to tune it for low performance.

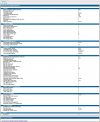
That aside, this screenshot tells us some things about your database configuration. It is unlikely to be very relevant to OpenEdge application startup time. That is more likely to be influenced by factors like:
  • whether your code is compiled, and if compiled whether it is .r or .pl, or a mix;
  • the depth of your propath and location of propath directories;
  • the network-related client startup parameters, e.g. -Mm, -q, etc.
  • where your code resides, relative to the clients (local or network shares);
  • the read throughput of the disks that store the code;
  • the location of the clients' temp files (-T);
  • the location of the OE code (local or network install);
  • the throughput of the network, if these are remote database clients or if the code is stored remotely.
 
Hi Sir Rob,

the application that i mean't was OpenEdge-based business application, and use that configuration.

I don't know the term but they call it Live Production which means that all client connected to the server & to that configuration, can you advice me what to do, to reduce the low performance? because some handed it over to with that configuration.

  • yes our code compile by .r i don't know if we have .pl.
  • what do you mean by the depth of propath?
  • this is the set of our parameter -db hms -S 8000 -H hms -N TCP -T C:\temp -p Z:\hms\general\main.r -d dmy
  • the code was on the network shares
  • what do you mean by read throughput throughput of the disks that store the code?
  • the -T (temp) for the client was on the local C:\
  • the location of OE code was on the local drive of the server with the database also been there
  • the database & code was on the server and share and map drive it to all client, because inside the code the drive was been hardcoded before so to lessen the time for the modification they map the code to each client.
 

Cringer

ProgressTalk.com Moderator
Staff member
Ok so you're trying to work out why your system is running badly with those parameters? Could you get the startup section from the db.log file instead of the screenshot please? I struggle at the best of times to remember what's what on that screen. In the db.log file, search for (333) and then copy the next 100 or so lines. That will be a summary of all your parameters used at startup.
 
Hi Sir Cringer,

Yes that's what i want, Please see the attached file i can't paste here because it said that i reach the 1000 line
 

Attachments

  • db_log.txt
    14.8 KB · Views: 4

Cringer

ProgressTalk.com Moderator
Staff member
  1. -lruskips is set to 0. Set this to 50.
  2. -B is very small indeed. I don't know how big your database is, but I doubt it's small enough to warrant such a small value. Multiply the value here by the DB Blocksize (4096) to work out how much space is being allocated.
  3. -L is very large, but then this value is probably set because of the application. Ideally you want to get the application fixed to not create such a massive lock table
  4. Before-Image Cluster Size: 524288 - seems a very large number. I'm guessing it was set so high for some maintenance and not reset. Use "proutil db -C truncate BI -bi xxxx" to set it to a power of 2. You want to monitor checkpoints and buffers flushed at checkpoint to see if this is set too low.
  5. -Ma 75, -Mn 5, -Mi 1. How many people use this system? If it's more than about 20-25 concurrent connections you're going to get some bottlenecks because you'll be having a lot of people connecting to the same server. Set -Ma smaller and -Mn higher. Make sure -Mpb is set correctly too.
  6. -n 301, so if you actually get 300 people connecting you're going to end up with 60 people connected to each server. Ouch.
  7. Do you have people connecting via SQL?
  8. -Mm 1024 seems small. IIRC this should be the same as the message buffer for your OS. 4096 or 8192 will most likely be correct. But be aware that every client that connects to the db must have the same -Mm value in their connect parameters
  9. Are you using OE Replication? Doesn't look like it, but you may need to visit -pica if you are
  10. -tablerangesize and -indexrangesize both set at default of 50. If you have more than 50 tables or indexes then you won't be able to see CRUD stats on all the tables making it a lot harder to establish what is degrading performance.
I'm sure other, more experienced DBAs will see more :)

Edited to remove the "10% horse-pucky" :)
 
Last edited:

TomBascom

Curmudgeon
Please stop repeating that 10% horse-pucky.

There is nothing "ideal" about having -B at 10% It is nothing but a "shot in the dark" guess at a starting value when you lack any information whatsoever about the load.
 

Cringer

ProgressTalk.com Moderator
Staff member
Apologies Tom. I'll stop repeating it! Nevertheless I'd hazard a guess that the current value is a little on the small side.
 

Cringer

ProgressTalk.com Moderator
Staff member
Got to have something to wind you up with - the ancient/obsolete crew seem to be reducing in number! ;)
 

Rob Fitzpatrick

ProgressTalk.com Sponsor
Before-Image Cluster Size: 524288 - seems a very large number.
512 KB is the default BI cluster size. For any application with even modest write activity it is likely to be too low.

Certainly this database configuration has lots of room for optimization. But let's not lose sight of the reported problem: application startup time. Unless that involves significant database I/O, far beyond simple authentication, my guess is that the database configuration is unlikely to be a root cause of slow startup time. But we know little to nothing about the application or topology, or how it used to perform, so all we can do at this point is guess.

I would start the clients with -y and -yx to capture some statistics from them. And I would add -q; it should always be used in a production environment. With the code on a network share that increases the performance penalty of OS stat() calls.
 

TomBascom

Curmudgeon
Your -B value of 9096 is ridiculously low. With 4k blocks that is just 36MB of RAM. That hasn't been a reasonable amount of RAM for the buffer pool since 1985. It is a wonder that your application can even start with such a small value.

Unless you are running the db on a TRS-80 you should be able to set -B to at least 100000. That would be 400MB of RAM. Obviously double check your available RAM via Windows perfmon or taskmgr but I would be shocked if you do not have enough free memory to set -B 100000.

The point of -B is to reduce IO ops by buffering data in memory. Disk IO (IO ops) is much, much slower than memory access. *Thousands* of times slower (milliseconds vs nanoseconds). The fastest access to data is when it sits in the buffer pool (-B). So you want as much of your database as is practical to be in the buffer pool.

There is, however, no point in allocating a buffer pool larger than the database ;)

If you are running 32 bit executables you are limited to 2GB (-B 500000 with 4k blocks). It is now 2014 and 2015 is just a couple of weeks away. Nobody should be running 32 bit databases servers.

The rough measure of buffer pool effectiveness is "hit ratio" or "hit percentage". This is the ratio of "logical access" (buffer pool reads and writes) to "physical access" (disk reads and writes). You can obtain this value from PROMON or Protop. I prefer Protop :)

Improving the hit percentage takes very large changes in -B. The effectiveness of -B is related to the *square* of its size. If you want to reduce disk IO ops by 50% you need to increase -B by a factor of 4. The Protop "BigB Guesstimator" can help you to project the likely improvement from changes to -B.

The hit percentage is not the end-all and be-all metric (bad code and table-scans can provide very misleading indications) but it is a useful starting point when you are trying to improve things.

Most of your configuration appears to be default settings. Those are unlikely to be optimum. Especially if you really have the 300 users that your -n implies.

Lowlights of your configuration:

-B 9096 -- this is obviously far too small. As I said, try 100000 for starters.

bi cluster size is 512k -- this is far too small for all but the most trivial databases, proutil hms -C truncate bi -bi 16384

-L is silly large -- but that is likely to be an application coding issues and not something that can be fixed by a DBA.

-lruskips 0 -- should be non-zero. As Cringer says 50 is a good start.

-prefetchDelay should be enabled, -prefetchFactor 100 is a good value.

-Mm should be larger. I like 8192 for starters.

If you actually have SQL connections (ODBC and the ilk) then there should be dedicated 4GL and SQL login brokers -- not "both".

I do not see an AIW being started or any other indication that after-imaging is enabled. After-imaging is essential to responsible database administration. Not enabling after-imaging is irresponsible.
 

Rob Fitzpatrick

ProgressTalk.com Sponsor
yes our code compile by .r i don't know if we have .pl.
If you are responsible for application troubleshooting you need to know everything you can about the application. You need to know all the directories and files that are in its propath, and you need to know what files are in those directories. If your clients have development licenses installed, make sure you really are running r-code and not compiling on the fly.
what do you mean by the depth of propath?
I mean the number of entries it contains: the number of directories and procedure libraries. Long propaths can be a cause of application performance issues, especially if the entries are poorly ordered. For example if there are ten directories in your propath, dir1 through dir10, and most of your r-code resides in dir10, then performance will suffer. Every time you run a program that resides in dir10 the client must search, unsuccessfully, for that program in dir1 through dir9 before finding it in dir10.
this is the set of our parameter -db hms -S 8000 -H hms -N TCP -T C:\temp -p Z:\hms\general\main.r -d dmy
If this is production, add -q to your client parameters. It is likely you would benefit from other client tuning but more detailed work probably requires hands-on work which I can't do. Do all of your clients connect with these parameters or do you have a mix of remote clients and self-service clients?
the code was on the network shares
An obvious place to investigate is the server or storage device on which the code resides (Z: drive?). Is the disk performing as it should? Is the network path between the clients and that device transmitting data at the rate that it should?
what do you mean by read throughput throughput of the disks that store the code?
When your application references a program (e.g. RUN foo.p), the Progress runtime (e.g. prowin32.exe or _progres.exe) has to read it from disk, whether that disk is local to the client or on a network. The throughput of a device, like a disk or a network device, is the sustained rate at which it can read or write data. So the faster the disk(s) that hold your code can read it and deliver it to the client, the less time the client will spend waiting for that I/O operation to complete, and the more responsive the application will feel to the user. The slower the disk, the more time the application spends waiting rather than doing useful work.
the -T (temp) for the client was on the local C:\
Good.
the location of OE code was on the local drive of the server with the database also been there
To be clear, I was talking about the Progress binaries (e.g. prowin32.exe, prow32.dll, etc. etc.); the Progress OpenEdge installation directory, also known as the DLC directory. Is this on a local disk for the clients (e.g. the C drive) or on a network share? A network install of Progress imposes a performance penalty, particularly on application startup time, as the code must be retrieved across the network before it can run.
the database & code was on the server and share and map drive it to all client, because inside the code the drive was been hardcoded before so to lessen the time for the modification they map the code to each client.

One of the most important questions to ask in a situation like this is: what changed? Has application startup time always been slow, or did it recently get worse? If the latter, did it get worse gradually or suddenly? Did IT people recently make hardware or software changes to the client machines, server machines, network? Software installation or reconfiguration, OS patching, OpenEdge changes? Was new application code delivered recently? Was the propath changed recently? Don't answer me; these are the questions you should be asking yourself. The answers will give you clues about which areas you should investigate further. You will have to do the detective work. Be sure to check the database log and the client logs for warnings or errors. Also check server and client machine OS logs for errors.

In the case of slow application performance, you want to know where the time is being spent. So I strongly suggest you get to know the OpenEdge profiler. It allows you to track which programs are being run by your client and which ones are taking the most time, even down to the line numbers within the programs. You will need someone, likely an OpenEdge developer or technician, who has some familiarity with it in order to collect the data. To analyze and make sense of the data you will need an application developer.
 
Hi to All,

Thanks for the opinion & suggestion, my mind gonna blow with your term, this is the first time i handle the DBA because before i only new was developing only and we were restricted everything relate on the database, i work here less than 2 months, now that all the IT here was gone except the technical now my manage turnover to me everything.. now i will start to study about DBA

Could it is possible to simply your terms like -lruskip ,-Ma, -Mn, -Mi,-Mm, -Mpb, -n,
-tablerangesize, -indexrangesize -prefecthDelay -prefetchFactor and the After Image how will i configure that? sorry for my ignorant this is the my first time

Hope everyone of you understand me

Thanks alot
 
Last edited:
all you see on the OE explorer image was the default configuration i think the only changes was the Block in DB Buffer, Lock Table Entries & Max User, we don't have SQL Connection

the specs of our server are

Processor : Intel Xenon X5650 2.67Ghz
OS : Windows Server 2008 R2 64Bit
Memory : 4GB
Harddisk : 120GB
 
Last edited:
Hi Rob,

What will be the value of -q? and what is the function of -q?

To be clear, I was talking about the Progress binaries (e.g. prowin32.exe, prow32.dll, etc. etc.); the Progress OpenEdge installation directory, also known as the DLC directory. Is this on a local disk for the clients (e.g. the C drive) or on a network share? A network install of Progress imposes a performance penalty, particularly on application startup time, as the code must be retrieved across the network before it can run.

the Progress Binaries was install only on the Local C:\ of the server and it was network share only to the client

Thanks
 
Top